VQA-VS
To alleviate the single-shortcut limitation and overcome three issues in practice, we construct and publicly release a new VQA benchmark considering Varying Shortcuts, named VQA-VS, and further standardize the OOD testing procedure.
Paper
Language Prior Is Not the Only Shortcut: A Benchmark for Shortcut Learning in VQA
Qingyi Si, Fandong Meng, Mingyu Zheng, Zheng Lin, Yuanxin Liu, Peng Fu, Yanan Cao, Weiping Wang, Jie Zhou
The 2022 Conference on Empirical Methods in Natural Language ProcessingEMNLP’2022, Findings
[ Arxiv | github | paperwithcode ]
Please cite this paper:
@article{Si2022LanguagePI,
  title={Language Prior Is Not the Only Shortcut: A Benchmark for Shortcut Learning in VQA},
  author={Qingyi Si and Fandong Meng and Mingyu Zheng and Zheng Lin and Yuanxin Liu and Peng Fu and Yanan Cao and Weiping Wang and Jie Zhou},
  journal={ArXiv},
  year={2022},
  volume={abs/2210.04692}
}
Data
The current OOD benchmark VQA-CP v2 only considers one type of shortcut (from question type to answer) and thus still cannot guarantee that the modelrelies on the intended solution rather than a solution specific to this shortcut. To overcome this limitation, VQA-VS proposes a new dataset that considers varying types of shortcuts by constructing different distribution shifts in multiple OOD test sets. In addition, VQA-VS overcomes three troubling practices in the use of VQA-CP v2, e.g., selecting models using OOD test sets, and further standardize OOD evaluation procedure. VQA-VS provides a more rigorous and comprehensive testbed for shortcut learning in VQA.
1.1 The VQA-VS dataset is provided below.
VQA-VS Annotations | VQA-VS Questions
For simplicity, the whole dataset (about 700+M, containing 1 training, 1 validation, 1 IID-Test and 9 OOD-Test sets) can be download here.
1.2 Other approaches to download our dataset.
The above links for downloading are based on Google Drive. If Google Drive is not avaliable for you, there are two approaches to downlownd our dataset:
a. Zip Compressed File
You can download the compressed files from our github repository according to the dir structure of data folder, and extract them separately.
b. Contact me
You can contact me by email siqingyi@iie.ac.cn, and I will send the complete dataset to you.
1.3 Matters needing attention.
a. Inference and Test
Note that all OOD test sets are the subsets of the IID test set. Therefore, you can choose to predict the answers for the questions of each OOD test set seperately to get their test accuracy, or you can choose to predict the answers for the questions of the IID test set directly, and then collect the corresponding prediction results according to the question-id of each OOD test set to get their test accuracy.
b. Images of VQA-VS
Note that our proposed benchmark is re-organized from VQA v2, therefore, the images in the VQA-VS datasets (both train, val and test) are from training and validation sets of the COCO dataset.
For simplicity, same as the practice for VQA v2 or VQA-CP v2, you can also download the image features (extracted by FasterRCNN) by:
wget -P https://imagecaption.blob.core.windows.net/imagecaption/trainval_36.zip
unzip coco/trainval_36.zip -d image_features/
1.4 Input Questions Format
{"image_id": 458752, "question": "What color is the players shirt?", "question_id": 458752002}
1.5 Annotations Format
{"question_type": "what color is the", "multiple_choice_answer": "red",
"answers": [
  {"answer": "red", "answer_confidence": "yes", "answer_id": 1},
  {"answer": "red", "answer_confidence": "yes", "answer_id": 2},
  {"answer": "red & white", "answer_confidence": "yes", "answer_id": 3},
  {"answer": "black", "answer_confidence": "no", "answer_id": 4},
  {"answer": "red", "answer_confidence": "yes", "answer_id": 5},
  {"answer": "red", "answer_confidence": "yes", "answer_id": 6},
  {"answer": "red", "answer_confidence": "yes", "answer_id": 7},
  {"answer": "red", "answer_confidence": "maybe", "answer_id": 8},
  {"answer": "red", "answer_confidence": "yes", "answer_id": 9},
  {"answer": "red and white", "answer_confidence": "yes", "answer_id": 10}],
  "image_id": 262146, "answer_type": "other", "question_id": 262146002}
question_type: type of the question determined by the first few words of the question. For details, please see README.
answer_type: type of the answer – “yes/no”, “number”, and “other”.
multiple_choice_answer: correct multiple choice answer.
answer_confidence: subject’s confidence in answering the question. For details, please see the VQA paper.
Dataset Analysis
2.1 Motivation of our benchmark.

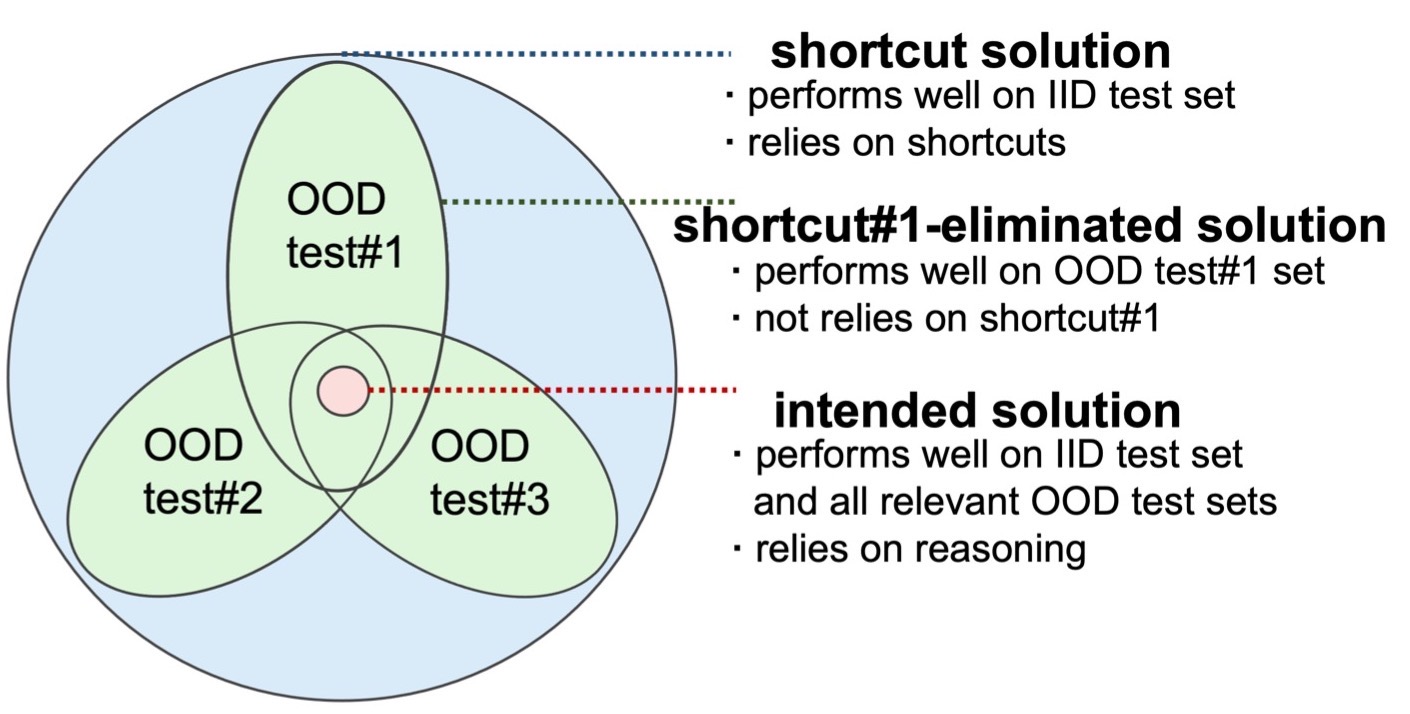
As shown in Fig. 1(a), despite performing well on VQA-CP v2, the debi- asing method LMH (Clark et al., 2019), can only boost its backbone model UpDn on few certain OOD test sets while fails to generalize to other OOD sets. This shows VQA-CP v2 cannot identify whether the models rely on other types of short- cuts (e.g., correlations between visual objects and answers). Therefore, as shown in Fig. 1(b), more OOD test sets are needed to measure the reliance of the model on different types of shortcuts. As the performance on more OOD test sets is improved simultaneously, the more confidently can the model be deemed to have learned the intended solution.
2.2 Data statistics.

Tab. 1 shows the data statistics of VQA-VS, and the group and sample statistics for each shortcut. The total numbers of groups vary significantly among different shortcuts (65 ~183683).
2.3 Relevance of Shortcuts & Overlaps Between OOD Test Sets.

Relevance of Shortcuts. The samples of head splits, which are frequent and dominating the model training, are the main cause of the shortcuts in training data. Therefore, we use the relevance of two shortcuts’ head splits in training set to analyze the relevance of two short- cuts. As shown in Fig. 2(a), the Jaccard Simliarity Coefficient between QT and KO shortcuts is obvi- ously higher. A possible explanation is that there is a strong correlation between question types and key-object types. For example, the question type “who is” and key-object type “person” co-occurfrequently. Moreover, the KOP shortcut is closely relevant with KO because the shortcut concepts of KOP are involved with KO concepts. Consequently, QT is highly relevant with KOP. The relevance extends to some of the other shortcuts in the same way, which can explain the light pink squares of Fig. 2(a). Differently, the coarse-grained QT and the fine-grained QT+KW have a low relevance even though the concepts of QT+KW include the QT concepts. This shows the necessity of introducing more fine-grained shortcuts which focus on a large number of concepts.
Overlaps Between OOD Test Sets. Intuitively, if two OOD test sets share too many samples, there is no need to separately evaluate the model on the two OOD test sets. To rule out this possibility and valid the necessity of nine OOD test sets, we count the numbers of duplicate samples between all OOD test sets and compute corresponding coincidence rates. From Fig. 2(b), we find that the coincidence ratios between most OOD test sets are low. Al- though (KO, QT) has a high coincidence rate 0.79, the coincidence rate of (QT, KO) is much lower, 0.49, which shows the KO has a different emphasis compared with QT.
Comparison And Baselines
3.1 Comparison of our benchmark and VQA-CP v2.

More details and analysis can be refered to our paper.
3.2 Performance of SoTA debiasing methods.

More details and analysis can be refered to our paper.